
Cpk Calculation Example: A Real 30-Piece Study
Direct answer: Thirty consecutive pieces were measured on a Ø24.0 ± 0.5 mm feature with a 0.01 mm caliper. Mean 24.085 mm, standard deviation 0.0303 mm, giving Cp 5.51 and Cpk 4.57. The numbers are real and the arithmetic is correct — but a Cpk above 4 is a statement about the tolerance band, not a boast about the process. Below are all 30 readings, the working, and the three reasons this figure cannot be compared with a Cpk of 1.33 quoted on a tight bore.
The 30 readings, as recorded
Specification 24.0 ± 0.5 mm (LSL 23.5, USL 24.5). Gauge: digital caliper, resolution 0.01 mm. Values are unrounded, in millimetres.
| # | 1 | 2 | 3 | 4 | 5 |
|---|---|---|---|---|---|
| 1–5 | 24.07 | 24.06 | 24.09 | 24.05 | 24.04 |
| 6–10 | 24.03 | 24.05 | 24.02 | 24.06 | 24.07 |
| 11–15 | 24.09 | 24.12 | 24.14 | 24.10 | 24.08 |
| 16–20 | 24.13 | 24.09 | 24.11 | 24.08 | 24.10 |
| 21–25 | 24.08 | 24.10 | 24.12 | 24.09 | 24.13 |
| 26–30 | 24.10 | 24.09 | 24.06 | 24.12 | 24.08 |
Max 24.14, min 24.02, total range 0.12 mm — 12% of the 1.0 mm tolerance band. Sum of all 30 readings: 722.55 mm.
Working it out
Nothing here is proprietary. This is the standard calculation, with the numbers from the table:
Σx = 722.55 → X̄ = 722.55 / 30 = 24.085 mm
s = √( Σ(x − X̄)² / (n − 1) ) = 0.03026 mm
Cp = (USL − LSL) / 6s = (24.5 − 23.5) / (6 × 0.03026) = 5.51
CPU = (USL − X̄) / 3s = (24.5 − 24.085) / 0.09078 = 4.57
CPL = (X̄ − LSL) / 3s = (24.085 − 23.5) / 0.09078 = 6.44
Cpk = min(CPU, CPL) = 4.57
Ca = |X̄ − M| / (T/2) = 0.085 / 0.5 = 17.0%
Note what drives the result: the process spread is 0.18 mm wide (6s) inside a 1.0 mm band. Cp is essentially the ratio of those two numbers, so it comes out at 5.5 almost by construction. Cpk is lower only because the mean sits 0.085 mm above the 24.0 target, which costs (0.5 − 0.085) instead of the full 0.5 on the upper side.
Why a Cpk of 4.57 is not the flex it looks like
Three honest reasons. A supplier who quotes you 4.57 without saying any of this is hoping you will not ask.
1. The tolerance band is generous — that is where the number comes from
±0.5 mm on a 24 mm feature is roughly ±2%. It is the kind of band a drawing carries when the dimension is a clearance or a stack-up contributor rather than the function-critical feature. Put the same process and the same 0.0303 mm spread against a ±0.05 mm band, and with the mean centred, Cp becomes 0.55 — under 1.0, which is to say not capable. Same machine, same operator, same day. The only thing that changed is the drawing.
2. A 0.01 mm caliper resolution on a 0.03 mm spread is coarse
The readings are quantised to 0.01 mm, about one third of the standard deviation. That quantisation inflates nothing in this particular case (the spread is genuinely larger than the resolution), but it does cap how much meaning you can read into the third digit of a Cpk. A capability study measured with a caliper tells you about a caliper-measurable characteristic — it does not transfer to a bore or a form tolerance, which needs a different gauge entirely.
3. n = 30 is a launch sample, not a capability study
Thirty pieces from one run will tell you whether the process is roughly capable. It will not tell you whether it drifts across a shift change, a new coil of stock, or a tool resharpening. Automotive practice for a formal capability study is typically 25 subgroups of five pieces, or at least 100 data points, precisely because a single 30-piece run cannot see that variation. A study of this size can separate capable from not capable; it cannot resolve 4.5 from 5.5, and nobody should quote it to two decimal places.
What we do instead on function-critical features: the tolerance is the number that matters, so we quote Cpk against it, name the characteristic, and state the sample size. On a Ø4 +0/−0.05 ground diameter — a 0.05 mm band — the honest target is Cpk ≥ 1.33 on nominated characteristics, and the gauge is a go/no-go plug or an air gauge, not a caliper. You can see that difference on a real package in the 316L sensor tube PPAP case, where the Ø3 bore is checked with a plug gauge and the gauge R&R was measured before any dimensional data was accepted.
What a capability sheet should tell you before the Cpk
| Question | Why it changes the number | This study |
|---|---|---|
| How wide is the tolerance band? | Cp is a ratio to the band; wide bands inflate it | 1.0 mm (±0.5) — wide |
| How many pieces, over what period? | Drift between shifts and lots is invisible in one run | 30 pcs, one run |
| What gauge, what resolution? | Quantisation and repeatability set the floor | Caliper, 0.01 mm |
| Is it a Cpk or a Ppk? | Within-subgroup vs overall variation answer different questions | Cpk, from overall s |
| Is the mean centred? | Cpk penalises offset; Cp does not | Ca 17% → Cpk 4.57 vs Cp 5.51 |
| Was the gauge validated? | %GRR above 30% makes the data unusable | Not run for this study |
The last row is the one most suppliers leave out. A study without a gauge R&R is not worthless, but it is unfinished: at 19% GRR a measurement system is conditionally acceptable, at 35% the capability figure is measuring the gauge as much as the part.
Questions about this study
Is a Cpk of 4.57 realistic, or was the data selected?
The data is 30 consecutive pieces from a production run, published above in full. The arithmetic is standard and reproducible. It is high because the tolerance band is 33 times wider than the process spread, which is a property of the drawing, not evidence of exceptional control. We publish the raw values precisely so the figure can be checked rather than trusted.
What Cpk should I require from a metal stamping or deep drawing supplier?
1.33 is the usual floor for an existing process on a nominated characteristic, and 1.67 is commonly asked for on a new launch or a safety-related feature. Below 1.0 the process is not capable and inspection cannot fix that — it only sorts the output. Ask which characteristic the figure belongs to; a single Cpk on an easy dimension says little about the tight ones.
Does a high Cpk mean I can reduce incoming inspection?
Only if the study covers the characteristic you are inspecting, over a period long enough to include drift, with a gauge you trust. A 30-piece study on a wide tolerance justifies reduced inspection on that dimension. It says nothing about a bore, a flatness callout, or a burr condition, which is where incoming rejections actually come from.
How does AUNOV report capability data in a PPAP submission?
As part of the PPAP file, on the characteristics the customer nominates, with the sample size, gauge and calculation stated alongside the figure. What we do not do is quote a single flattering Cpk on a landing page and leave the basis unstated — which is the reason this page shows the 30 readings and the derivation. The material compliance page lists the documents that accompany each submission.
Where this fits
Capability numbers only mean something next to the process that produced them. If your part is a drawn shell rather than a tube, the tolerances that matter are different — the case study library shows how the same discipline is applied to drawn, coined and ironed parts.
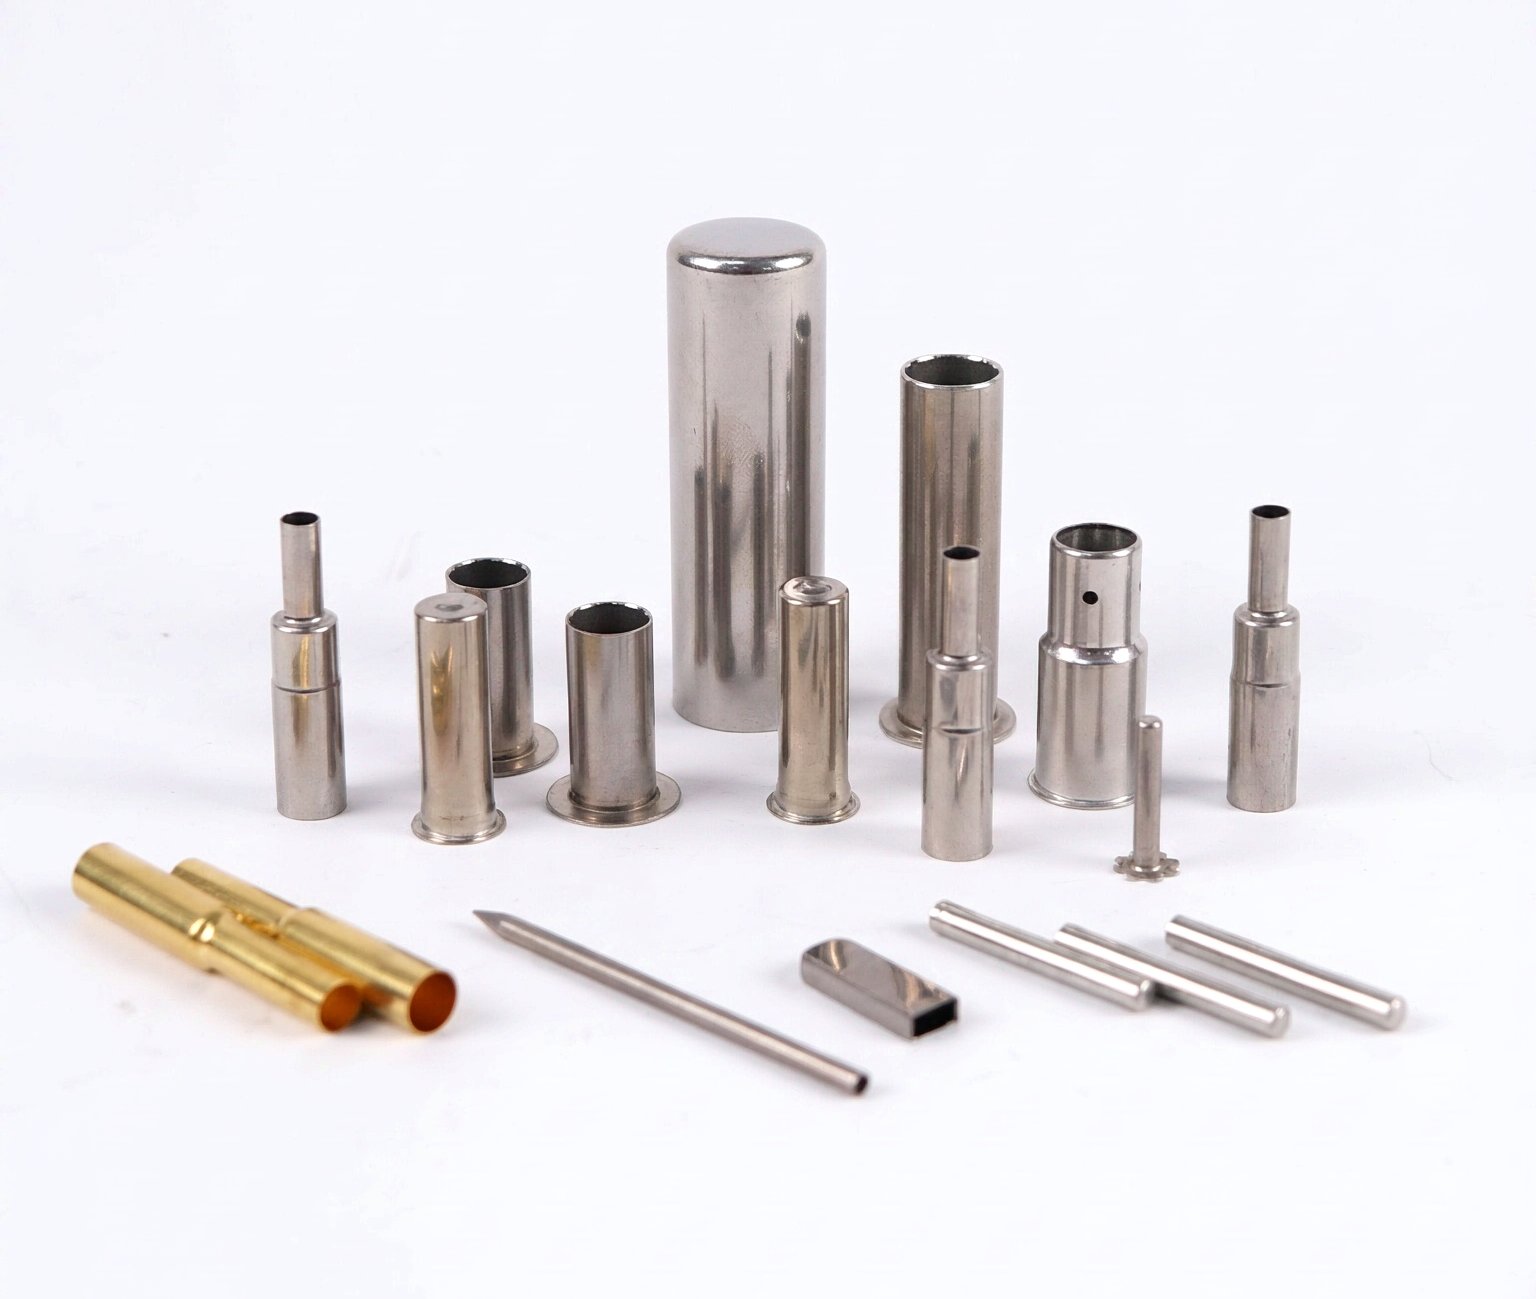
Part number, customer identity, tester name and gauge serial number have been removed from this study. The 30 measured values, the specification limits and the derived capability indices are reproduced as recorded in the original inspection file. Photograph is representative of the product family, not of the specific lot measured.
Standards Behind the Numbers
The formulas and limits in our tools are anchored to the material properties measured by the standards below. We validate each tool result against a trial draw on the real material.
- ASTM E646 — Standard Test Method for Tensile Strain-Hardening Exponents (n) of Metallic Sheet Materials. The n-value sets how much a wall can thin before necking.
- ASTM E517 — Standard Test Method for Plastic Strain Ratio (r) of Sheet Metal. The r-value predicts earing in drawn cups.
- DIN 8584 — Manufacturing processes, forming: classification of deep drawing operations and their subgroups.
- ISO 20482 — Metallic materials: Erichsen cupping test, a formability measure complementary to LDR.
- Wikipedia: Anisotropy — explains the r-value and why earing directions form.